Highly qualified professionals united by 1 target: conducting analysis of the current Forex conditions

FXPrestige has been enlarging its staff with the goal to provide its customers with comprehensive and highly reliable analytics.

Awesome customers support services by dedicated professionals

- Dedicated Support Areas - Comprehensive Contacts Information - Credible Introducing Offices - Callback Service - Journalist Inquiries -

FXPrestige - Future Leader In Online Trading!

We open new HORIZONS for opportunities...

Forex learning course for beginners by FXPrestige

Exclusive distance course, written by the company's traders and analysts, based on the most popular and user-friendly MetaTrader 4 platform.

Today, FXPrestige services are of great interest for thousands of traders and partners all over the world

Offering the most generous and rewarding affiliation and partnership programme globally.

Showing posts with label Intermarket Studies. Show all posts

Monday, 15 August 2016

How to Use the Dollar Index for Forex Trading

FEATURED ARTICLE


I bet you’re wondering, “How do I use this USDX in my trading arsenal?”
Well, hold your trigger finger and you’ll soon find out! We all know that most of the widely traded currency pairs include the U.S. dollar. If you don’t know, some that include the U.S. dollar are EUR/USD, GBP/USD, USD/CHF, USD/JPY, and USD/CAD.
What does this mean? If you trade any of these pairs, the USDX can be the next best thing to sliced bread (or hamburger on a bun… or chocolate ice cream).
If you don’t, the USDX will still give you an idea of the relative strength of the U.S. dollar around the world. In fact, when the market outlook for the U.S. dollar is unclear, more often times than not, the USDX provides a better picture.
In the wide world of forex, the USDX can be used as an indicator of the U.S. dollar’s strength.
Because the USDX is comprised of more than 50% by the euro zone, EUR/USD is quite inversely related. Check it:

Next, take a look at a chart of EUR/USD.


It’s like a mirror image! If one goes up, the other most likely goes down. Will you look at that? It seems like the trend lines almost inversely match up perfectly. This could be a big help to those big on trading EUR/USD.
Some of our forex trading friends in the forums monitor the USDX as an indicator for EUR/USD. Hang out with them if you wanna learn more about using this index.
If the USDX makes significant movements, you can almost surely expect currency traders to react to the movement accordingly. Both the USDX and forex traders react to each other. Breakouts in spot USD pairs will almost certainly move the USDX in similar breakout fashion.
To sum it all up, forex traders use the USDX as a key indicator for the direction of the USD.
Always keep in mind the position of the USD in the pair you are trading.
For example, if the USDX is strengthening and rising, and you are trading EUR/USD, a strong USD will show a downtrend on the EUR/USD chart. If you are trading a pair in which the USD is the based currency, such as the USD/CHF, a rise in the USDX will most likely show a rise in USD/CHF charts like the one shown below.


Here are two little tips you should always remember:
If USD is the base currency (USD/XXX), then the USDX and the currency pair should move the same direction.
If USD is the quote currency (XXX/USD), then the USDX and the currency pair should move in opposite directions.
------------------------------------
Read the original HERE

Thursday, 11 August 2016

How To Profit From Correlation Between Currencies And Oil Volatility

FEATURED ARTICLE


Crude oil futures entered a steep bear market in 2014, following a multi-year trading range set into place after the 2008 economic collapse. While futures and equity buyers have lost fortunes trying to pick the bottom, many currency traders have prospered, taking advantage of tight correlation between energy futures and forex pairs that react to the sector’s high volatility. Let’s identify these correlations and how they trade, with a sharp focus on applying this knowledge to the gyrations in the crude oil market.

Given the wild price actions in 2014 and 2015, it’s likely the energy sector will carve out wide swings and multi-week trends for the next two-to-three years at a minimum, offering forex players numerous opportunities to profit. We will focus on the most popular and highly liquid pairs, with tight bid/ask spreads and easy access for U.S. currency traders. More thinly traded instruments may work as well, but they tend to carry higher costs. Most of these crosses can be found in Central and South American nations that are highly dependent on the price of crude oil. These include Brazil, Columbia, Venezuela and Mexico.

Canadian Dollar

Not surprisingly, Canadian forex crosses show tight correlation with crude oil contracts. The resource-rich nation has massive energy reserves, which strongly impact gross domestic product (GDP) and foreign trade balances. (For more, see The 5 Biggest Canadian Oil Companies.) Since crude oil is calculated in U.S. dollars, the USD/CAD pair works as a nearly perfect proxy for crude oil gyrations — both higher and lower.
This pair generates an inverse correlation since the Canadian dollar represents the denominator in the cross, advising traders to look for the pair to rally when crude oil is selling off and vice-versa. The correlation tends to ease up when precious and industrial metals are moving more forcefully than crude oil because mining produces the country’s other great source of naturalwealth.

The U.S. Oil Fund (USO), an exchange-traded equity proxy for the WTI crude oil contract, and the forex pair USD/CAD, show tightly inverse price action between the 2008 to 2009 bear market and the third quarter of 2015. The cross topped out in 2009 when crude oil pounded out a bottom and entered a two-year uptrend. In turn, USD/CAD turned lower in a perfectly inverse two-year downtrend. The instruments turned once again in 2011, with crude oil posting a recovery high, ahead of a three-year trading range.

The correlation eased up between the 2011 reversals and the 2014 breakaway trends. USD/CAD entered an uptrend during this interim period, while crude oil ground sideways, testing upper and lower boundaries. The relative detachment points out a common but poorly understood characteristic of correlation—it tends to expand during periods of rising volatility and contract when volatility eases up.
The USD/CAD uptrend escalates in June 2014 when crude oil enters a new downtrend, breaking multi-year support and heading into a test of the low posted in the prior decade. The Canadian cross responds with a rally to an 11-year high. It tends to lead the futures contract throughout this period, acting as a leading indicator for gyrations in the energy pits.

Australian Dollar

The Australian dollar cross against the U.S. dollar, trading as AUD/USD shows high correlation with crude oil as well. This appears unusual at first glance because Australia holds just 0.3% of the world’s oil reserves. However, the country has massive copper, gold, iron ire and nickel reserves that dominate its GDP, highlighting the correlation between commodity classes, especially in recent years. Electronic trading and new derivatives have tightened these relationships because broad commodity baskets can be bought or sold as risk-on or risk-off hedges in reaction to shifting sentiment in the equity and bond markets.

Crude oil and AUD/USD bottom out in unison in 2009 and enter similar uptrends that extend into historic 2011 highs that haven’t been breached in recent years. While the correlation declines between the 2011 highs and 2014, the instruments follow similar trajectories, with relative highs and lows occurring at the same time.
The instruments break down in strong downtrends in the middle of 2014. Crude oil gets cut in half during this period, whileAUD/USD drops approximately 25%. Relative highs and lows intensify correlation readings, with nearly identical price action into the second half of 2015. This lockstep behavior should ease up when crude oil begins the inevitable bottoming process, lowering volatility levels.
The percentage change differential illustrates how correlation impacts trend direction and price structure across instruments but does not predict the size of gains or losses. This is especially true when working with currencies because they exhibit price band behaviors that stretch across many decades while other instruments can, theoretically at least, rise to infinity or fall to zero.

The Bottom Line

U.S. dollar crosses with the Canadian and Australian dollars offer easy access to crude oil gyrations since both crosses show extremely tight correlation with the energy markets. This correlation has grown even stronger in the recent years, with crude oil now working through a volatile downtrend.
==============================
Read the original article HERE

Saturday, 30 July 2016

Track The Largest Traders With The COT Report

FEATURED ARTICLE


Talking Points:
  • What Is The Commitment of Traders Report?
  • Who Are the Players In The Report?
  • How to Read CoT for Directional Bias
What Is the Commitment of Traders Report?
How would you like to know what the smartest guys and girls in the room are doing? Thanks to a requirement by the Commodity Futures Trading Commission, the largest futures traders in the world are required to report their positions which can easily be tracked due to the margin they must pay to hold their large positions which the CFTC has been publishing since 1962 and since 2000, every Friday at 3:30ET pm. This information can be of extreme help due to the people who come into the Futures market like hedge funds to make a return above their respective index or some of the largest companies in the world with real-time data of the health of the economy that come to the futures market to hedge their exposure to price fluctuations of raw materials that they use to make their product or preform their service.
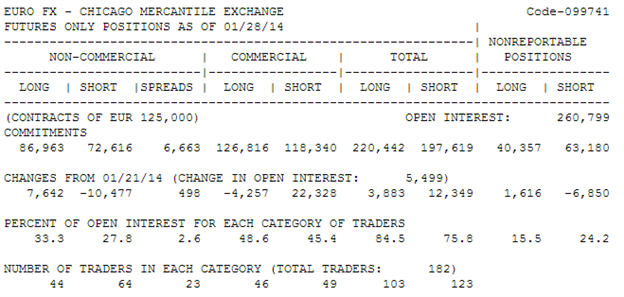
Learn Forex: CoT Report for Euro FX (EURUSD) as of 01/28/2014
CoT_body_Picture_1.png, Track The Largest Traders With The Commitment of Traders (CoT) Report
It may be helpful to think of the CoT report as a sentiment indicator with a lot more depth than most indicators. The depth, of course, comes from the fact that the readings are based on the largest future traders and can help you see when large fortune-500 companies switch their outlook on something that you’re trading. In short, this report provides incredible levels of insider intelligence that you’d be hard-pressed to find in another avenue.
Who Are the Players In The Report?
Commercials – Using the futures market primarily for hedging unfavorable price swings to their daily operations. They likely have the best insight as to what the demand and future is for the market as a hole and have some of the deepest pockets. These players are also known as commercial hedgers.
Examples: Coca Cola in the Sugar Market or American Airlines in the Gasoline Market
Non-Commercials (Speculators / Funds) – Traders, whether hedge-funds are large individuals, who have no interest in taking delivery but are rather in the market for profit and meet reportable requirements of the CFTC.
Examples: Hedge Funds and large banks or large Commodity Trading Advisors (CTAs)
Nonreportable Positions – Long & Short open interest on positions that don’t meet reportable requirements, i.e. small traders.
Examples: This is the leveraged players without deep pockets and are shaken out on big moves, similar to the DailyFX SSI.
How to Read the CoT for Directional Bias?
Upon the first reading of the CoT, you may be confused how future positions in USD, JPY, GBP or EUR could be helpful for trading EURUD, USDJPY, or EURGBP. There is a lot to learn about the Commitment of Traders report but what’s often helpful is to find when there is a very strong divergence between large speculators and large commercials.
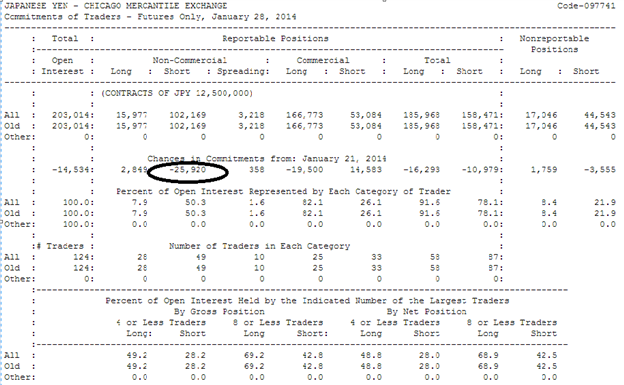
Learn Forex: Look to See What Hedge Funds Are Buying Selling
CoT_body_Picture_2.png, Track The Largest Traders With The Commitment of Traders (CoT) Report
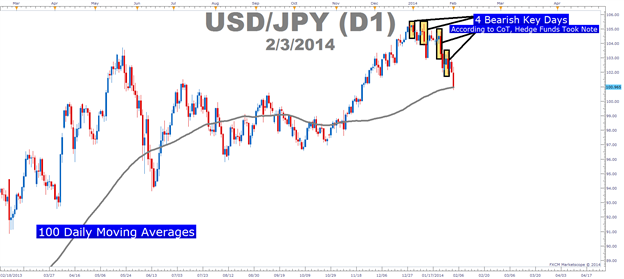
Learn Forex: Non-Commercials / Hedge Funds Sold USDJPY Longs & Charts Confirm This
CoT_body_Picture_3.png, Track The Largest Traders With The Commitment of Traders (CoT) Report
Presented by FXCM’s FXCM Trading Station 2.0
The first place to start with is a clean understanding of Net Positioning which is shown clearly on the reportsand the week over week differential of major market bias (circled above). It may be helpful to know that what you’re looking for isn’t as much the specific number but a clear sign in % of open interest or bias so that you see Non-Commercials / Funds flipping against the primary trend. Furthermore, when you see a key flip in sentiment of non-commercials / funds who are in it for the money and not to be hedged like commercials, and there is a confirmation on the charts that a trend is exhausting, you are likely trading in the direction of the big kids.
As you can see from the last report in January, the number of funds off-loading the JPY shorts increased dramatically from the week prior. When you see this type of shift from major funds, you can look for other signs that show the prior trend is losing steam and that maybe you should exit the trade too. The chart above of USDJPY notes that there have been 4 bearish key days on USDJPY since the start of 2014 at the same time non-commercials have unloaded their USDJPY longs / JPY shorts giving credence that this move down may have more to go.
Another excellent tool, is the Commitment of Traders Analysis from DailyFX. This weekly report provides analysis of the CFTC report, showing the positioning of Forex futures trades with a synopsis of the key flips in positioning. This report also helps traders by providing 52-week percentiles of major moves so you can see if we’re currently at annual bullish / bearish extremes so that you should be tightening stops or looking for price action to confirm the funds are selling out so that you can follow.
Bottom Line: Look for Chart Validation of what the Non-Commercial Are Doing. When you have a large percentage (greater than 10%) of non-commercials flipping their bias, it’s time for you to take note. Lastly, if you want to really juice up your understanding of market sentiment, you can get a better feel for how a sample group of non-reportables or smaller traders like FXCM customers are positioned in OTC FX via the DailyFX Speculative Sentiment Index which is updated twice a day.

_________________________________________
Read the original article HERE